Pitting NFL Markets Against Themselves
Using NFL moneyline markets to simulate the season and compare the results to futures markets.
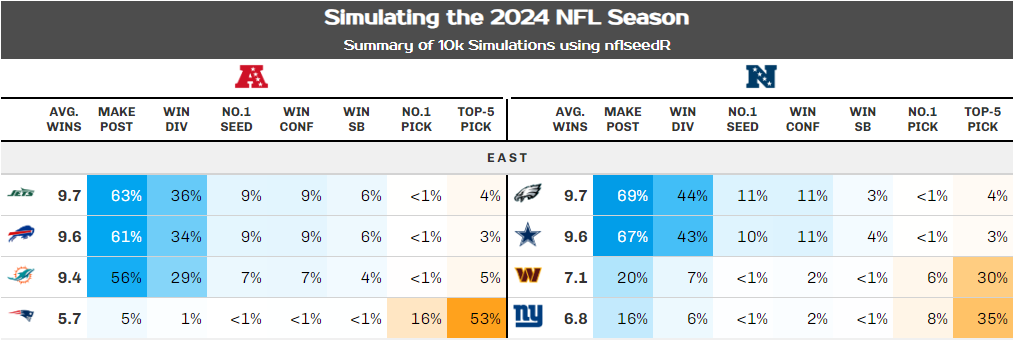
This simulation aims to capitalize on the fact that sportsbooks have all but perfected their predictions in order to maximize their profit. Using the implied probabilties of the moneyline markets as the win rates, I simulated the season 10000 times and compared those results to the future win total markets to look for anywhere there might be an edge. This model isn't perfect, but this project was an interesting lens to view EV through and a fun way to play around with nflseedR.
Fantasy Football Newsletter
Example of my weekly newsletter I send out to my fantasy football league mates.

The weekly newsletter that I send out to my league was a big hit throughout this past season. This was my first season doing it, and it started as a pretty short email with a few charts in week 2. It grew very quickly from ideas I had and league recommendations so there was something new practically every week. Now that it's mostly steady state the statistics portion is fully automated using a yahoo fantasy API and all charts and tables are populated and generated using R. The newsletter itself is HTML and CSS, and is hosted on my site for easy access. This has been a very fun project, and I think I might try my hand at a fantasy football dashboard next season.
Fantasy Football Wrapped
Like Spotify Wrapped but for each team in my fantasy football league.
After publishing a weekly newsletter for the majority of the season, I thought it was only appropriate to end the season with a Spotify Wrapped style presentation for each team. Here is the wrapped for the last place team in our league, Miles away from a Championship. This was completed using RMarkdown to generate all 12 presentations in one go. Sadly this doesn't work well on mobile.
Technical Analysis Pattern Recognition Using Convolutional Neural Networks
An independent study project I completed at RIT
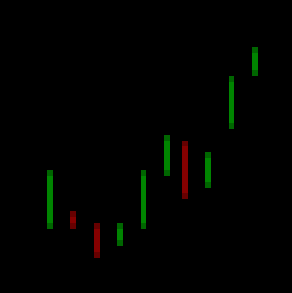
Technical analysis is a method of using candlestick chart patterns to attempt to predict the price movement of a tradable asset, such as a stock or cryptocurrency. Many traders identify patterns manually due to the subjective nature of technical analysis. Using convolutional neural networks, the manual subjective pattern recognition process can be simulated and would be more generalized than hard coded or mathematical methods. The developed model identifies patterns with a 66% accuracy when compared to the hard-coded method. While this accuracy is not high enough to measure the level of generalization, this model could be used as a stock screener using automated pattern recognition.
This project was a great learning experience and gave me further exposure to neural networks. My full findings can be found in this paper. This paper earned the 2nd place prize at the 2022 IISE Northeast Regional Conference.
RIT Energy Forecasting
Forecasting RIT's Energy Usage Using Neural Networks
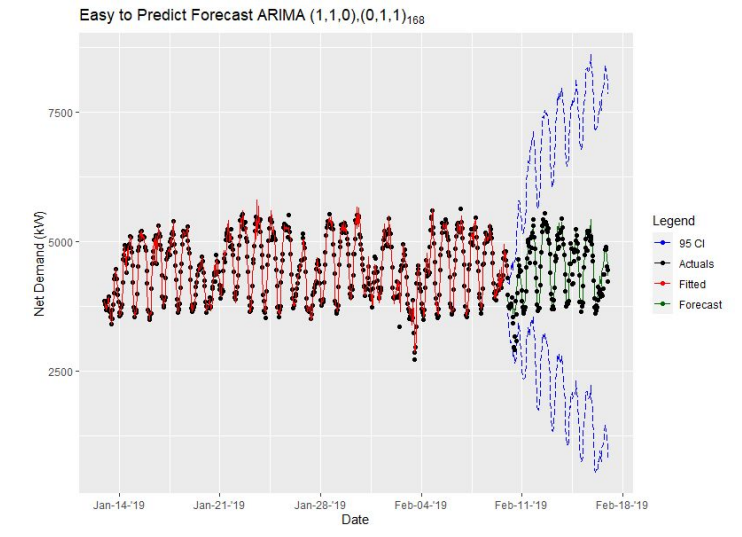
RIT consumes a large amount of energy and wants to reduce the peaks of this consumption to reduce cost. Using neural networks, this consumption was modeled and forecasted to attempt to predict these peaks. Different neural network models were evaluated, and the best one was recommended for use by RIT.
The first part of this project was data cleaning, and that was summarized in this poster.
This presentation gets into the weeds of this project in terms of model evaluation.
This paper is the final result of this semester long project completed for a graduate course at RIT.
Wordle Difficulty Analysis
A small project analyzing the difficulty of Wordle games.
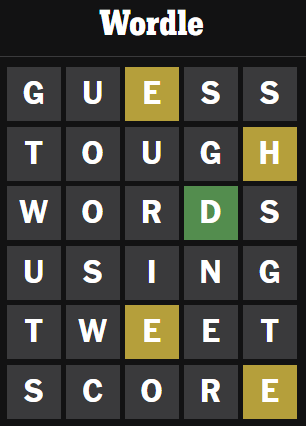
This project was for a course I took at RIT to learn more R. This project required the use of data from Twitter, and took place right after the initial Wordle craze. Using Wordle results from Twitter users, I analyzed the difficulty of Wordle games over the course of one week. I mention in the discussion that it would've been great to have more historical data but I was limited by the API. I also mention the role of survivorship bias, as individual players are probably less likely to tweet out their poorer scores. This project was also completed using RMarkdown.
NBA Salary Prediction
Another small project attempting to predict NBA player salaries based on a few variables.
This project was also for a course I took at RIT to learn more R. For this project we were given a choice from a variety of datasets provided to us. I saw there was an NBA dataset and jumped at the opportunity, even if it was outdated. This was my first real project in R, and I hope to dig into current NBA data in my free time in the future.
Fat Foot Feetball
A hackathon project from pre-pandemic that was my first real experience in a coding environment.
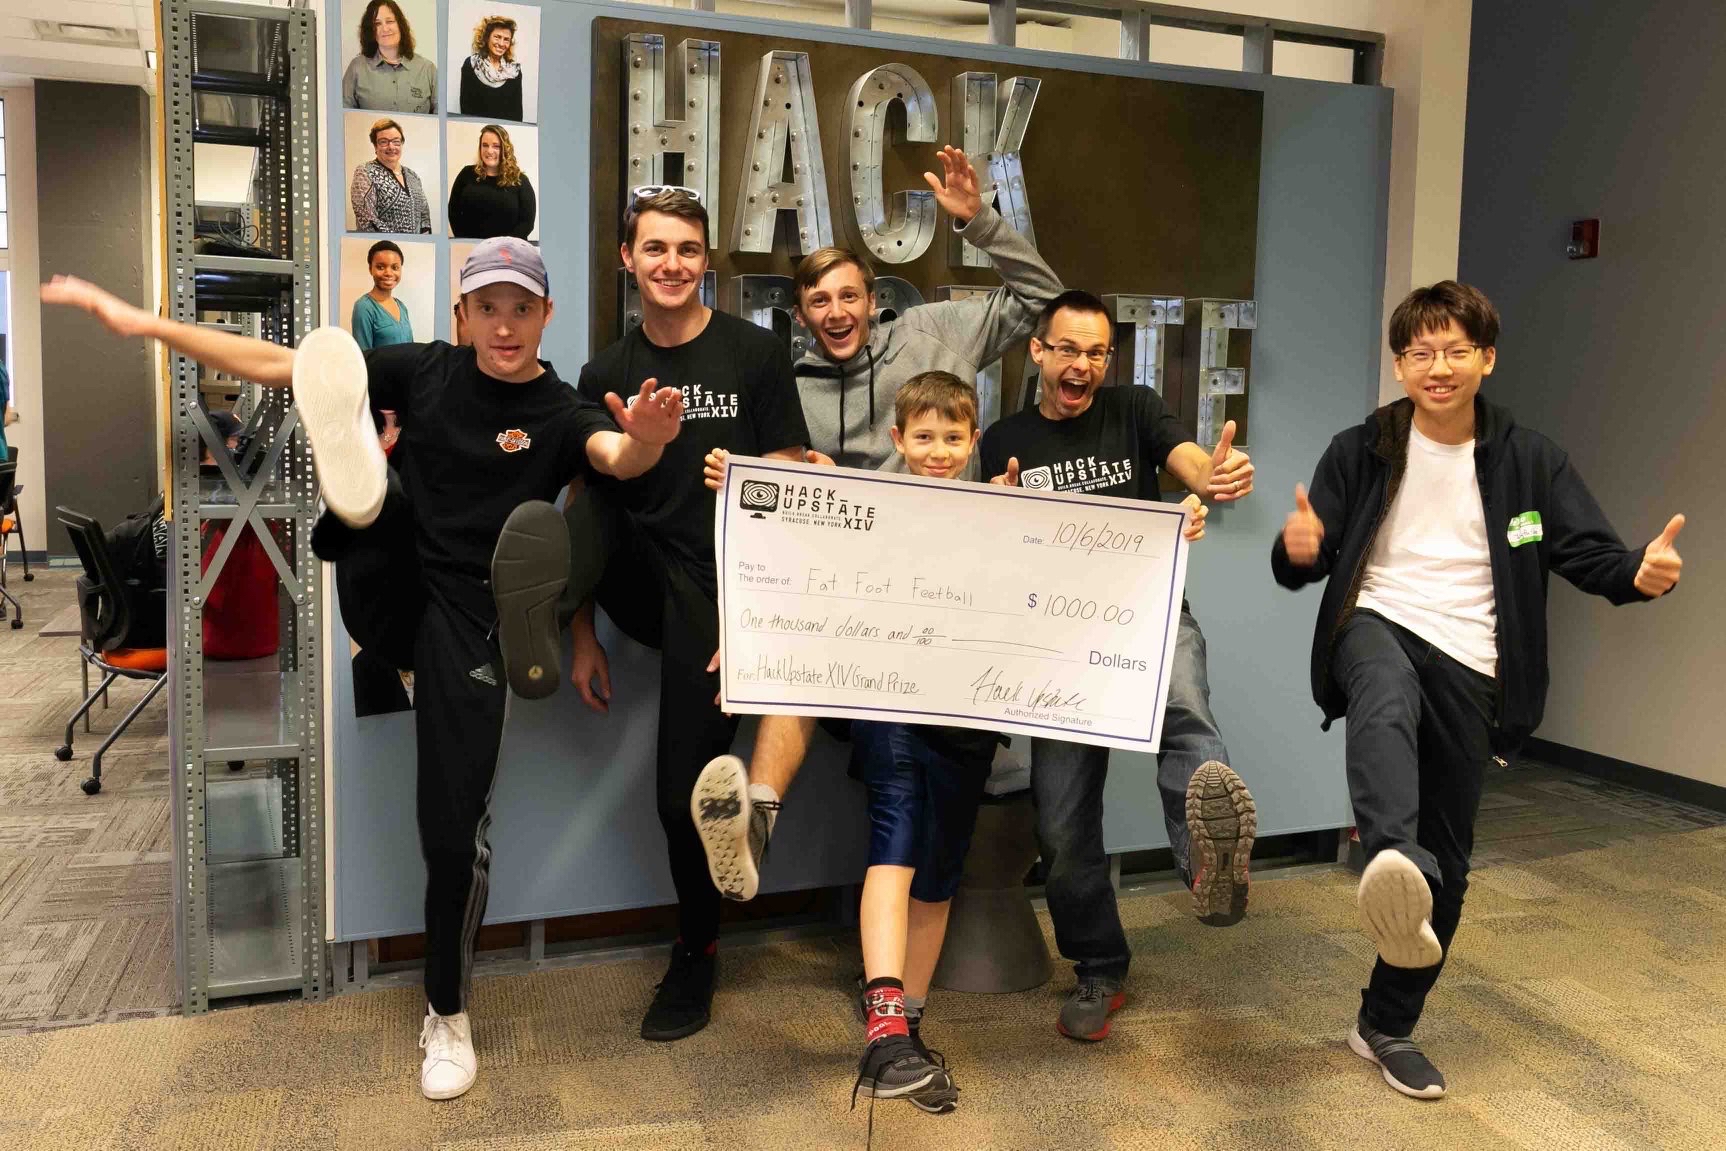
Fat Foot Feetball was (in my humble opinion) the fantastic result of 24 straight hours of work from a team of 6 people. It is a 2D soccer game inspired by a flash game my friends and I played all the time in high school. It allows two friends to go head to head in a first-to-seven soccer match, and was built on Unity using a 2D game template. This crazy project somehow ended up winning the Grand Prize at Hack Upstate XIV. You will be able to see why none of us continued with game development, but may have some fun with the broken physics in the game. My favorite broken thing is if you get both characters together pushing towards the ball and one character jumps you can fly. The game also features Nic Cage, which we think pushed us over the edge for the grand prize.
About Me

I am currently the Lead Data Scientist at WalterPicks, and I also enjoy exploring data in my free time. I was able to land this amazing job at WalterPicks due to my passion project of fantasy football analysis for my main league. My other hobbies include playing and watching basketball (primarily NBA), playing video games like Rocket League, Balatro, Slay the Spire, and Spider-Man, and enjoying nature which involves walking, biking, or golfing. I currently live in Buffalo NY with my partner Leanna and our cat Misa.
Obligatory Cat Photos